How Did Nintendo Power’s Top 20 Scoring System Work?

Update: I was able to find more information about this topic. You can head over to the follow-up article to get more details about the scoring system. The full text of the original article is below.
Whether you’re gawking at amazing cover art or anxiously looking for the Nintendo Power Awards, it’s always fun to flip through the pages of old Nintendo Power magazines from the 1980s and 1990s.
If you pick up a Nintendo Power mag from the SNES era, you might find the Top 20 lists (or even Top 30). These lists feature the 20 (or 30) hottest games from each Nintendo console, ranked by a vote-in scoring system. (I haven’t been able to pinpoint exactly when the practice began or ended, however, as the Retrovolve Nintendo Power collection has some big gaps in it.)

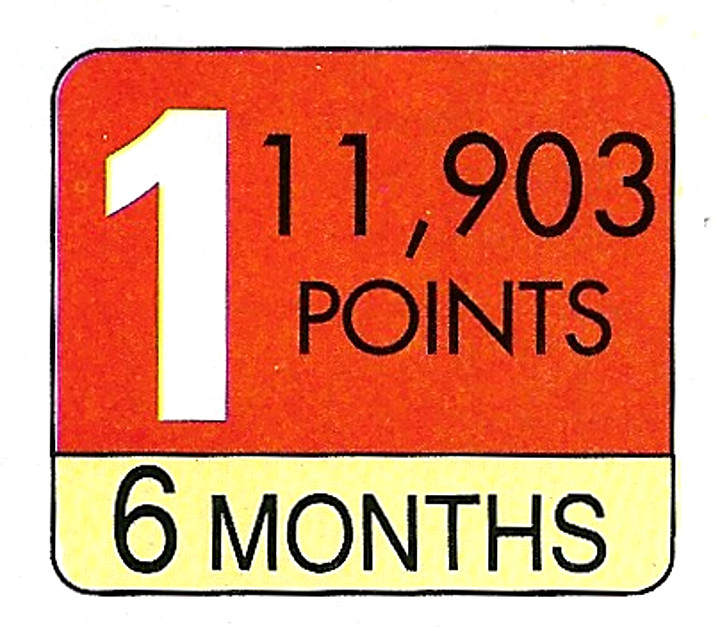
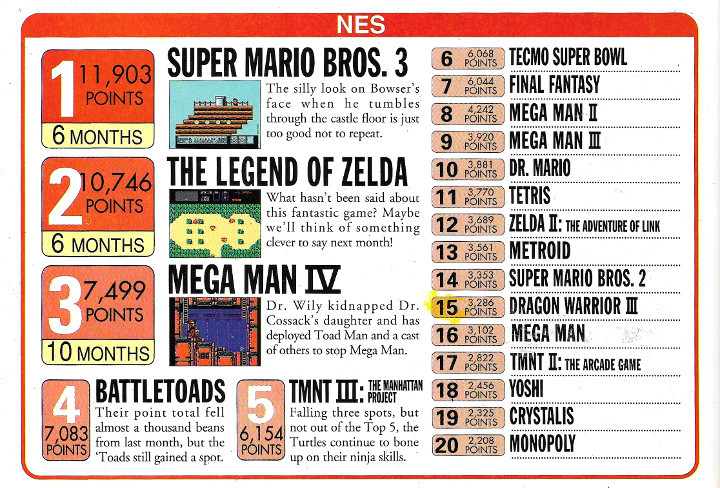
The above image (from Issue 43 of Nintendo Power, dated December, 1992) shows a close-up of what these scores looked like. This particular score is for Super Mario Bros. 3, which was the top-scoring game at 11,903 points.
As for the months, I really can’t tell you what that means. My initial assumption was that this was how many months the game had been on the list, but after thumbing through several consecutive issues, the numbers seem completely random.
In Issue 42, Super Mario Bros. 3 is at 37 months, in Issue 43, it’s at 6 months, and in Issue 44 it’s at 39 months. So perhaps the 6 shown above is a misprint? Maybe it was supposed to be 38? The problem is there’s no consistency in the other games either. In Issue 43, The Legend of Zelda is at 6 months, and in Issue 44 it’s at a whopping 52 months. What?
My guess is that the goal was to show how many months each game was in the Top 20, but magazine deadlines caused this section to get neglected a bit, resulting in a perpetual chain of misprints. Keep in mind that the Super NES was out by this point in history, so perhaps fact-checking the NES section simply wasn’t at the top of anyone’s to-do list.

So how were these scores tallied?
Every issue of the magazine came with a survey card, which allowed you to vote for your favorite games. To lure people into actually sending the surveys (let’s be honest, no one actually wants to be doing a survey), they gave out some sweet prizes. In the issue I posted all of the above images from (Issue 43), here were the prize breakdowns:
Grand Prize:
- A trip for two to New Orleans
- Tickets to the NCAA Final Four Games
- A copy of NCAA Basketball for SNES
Second Prize (10 winners)
- Official NCAA Championship basketballs
- A copy of NCAA Basketball for SNES
Third Prize (50 winners)
- A Nintendo Power T-shirt
I wonder if there are any of those T-shirts still floating around…
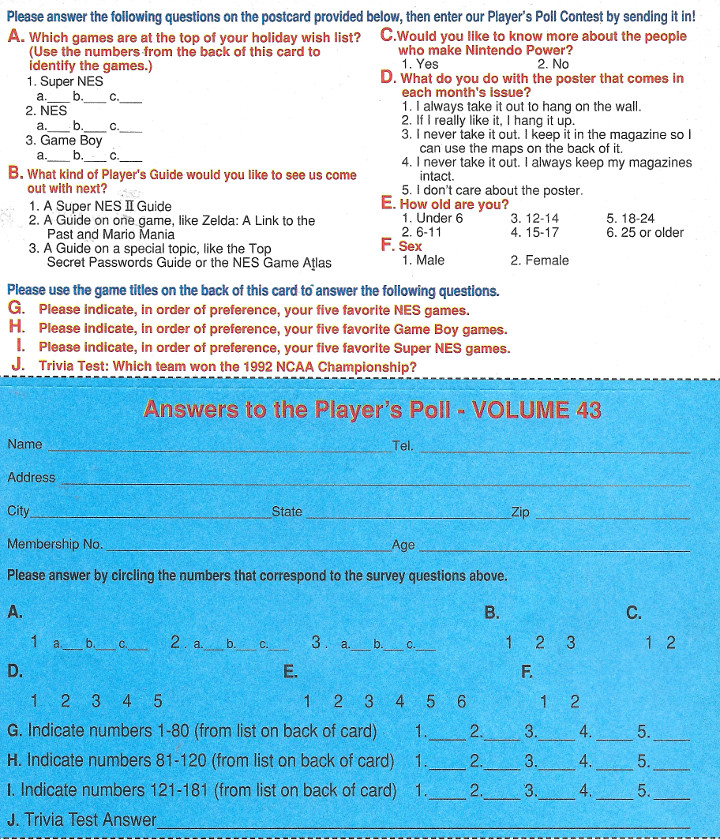
Anyway, here’s a picture of what the survey cards looked like.

Yeah, they’re not terribly exciting to look at. If you’re wondering why the blanks to fill in your favorite games are so small, they are actually all number-coded on the back of the form. Super Mario Word is #179, for example, and Super Mario Bros. 3 is #65.
At the risk of overextending what’s probably already the most boring article in Retrovolve history, I wanted to point out that the scores, as far as I can tell, seem like they refresh every month. This makes me wonder how many freaking subscribers Nintendo Power had back then, and also, who tallied all these scores?
The scoring system would eventually get phased out (again, I’ve not been able to nail down a specific issue where the shift happens), but the surveys would continue for quite a while afterward. I’m not sure what they were using all of that data for.
So there you have it. If you’ve ever wondered how the scoring works in the Nintendo Power Top 20s, you can sleep a little bit easier tonight knowing you learned something today.

But you didn’t get to the bottom of it. What are the number of months? You aren’t sure. What are the points? Also not completely sure. Do some research man!
Do you have more information about this?
I don’t ask to be snarky. I’m genuinely curious, because I spent a lot of time digging for answers to these questions and I’ve not come up with anything concrete.The numbers are votes, but those numbers seem inflated to me. I would be interested in learning more about Nintendo Power’s ballot system, and how those were tallied.
I followed up on this and was able to dig up more information. Here’s the fresh article:
https://retrovolve.com/a-deeper-dive-into-nintendo-powers-top-20-scoring-system/
The 80’s and 90’s issues are all digitized on RetroMags.com. The Top 30 goes back to issue #1. Beginning with issue #32, they expand this to the Top 20 for each system (so 60 games total). A blog post from 2008 has a lot of data on this: http://vgstats.blogspot.com/2008/02/nintendo-power-charts-nes-index.html.
Killer find! I think this would be worth doing a fresh article over!
For the current article, I used the physical copies I had on hand. I’ll dig through some digitals to get a better picture of how this all works and try to put something together.
I posted a follow-up.
https://retrovolve.com/a-deeper-dive-into-nintendo-powers-top-20-scoring-system/
Thanks again for sharing the info!